GRR vs. NRR: Key differences & How to improve revenue retention

The numbers are striking - getting a new customer can cost up to 25 times more than keeping an existing one. Your business growth depends on understanding the difference between NRR and GRR.
These metrics reveal different aspects of your company’s health. GRR reflects your customer stability, and NRR shows how much you can grow. The choice between these metrics isn’t always clear-cut. Let’s look at how these two key metrics work together to guide your revenue decisions.
What is Gross Revenue Retention (GRR)?
Gross Revenue Retention (GRR) shows how much recurring revenue you keep from existing customers during a specific period without counting expansion revenue. This metric tells us how well you maintain stable revenue from your current customer base when we don’t look at upsells or cross-sells.
Related Read: What is Gross Revenue Retention
Definition of GRR and Why It’s Critical
GRR is the foundation of your business’s financial stability. This metric helps assess how well your customer retention strategies work. Your company’s predictable growth becomes evident through strong GRR as customers stick to their contracts. Enterprise B2B SaaS companies should aim for 90% GRR as their baseline, while industry leaders like Workday reach about 95%.
Formula: How to Calculate GRR
The formula to calculate GRR is:
GRR = (Starting MRR - Downgrade and Churned MRR) / Starting MRR x 100%
Key components of this calculation include:
- Starting MRR: Monthly recurring revenue at period start
- Churned MRR: Revenue lost from cancellations
- Downgrade MRR: Revenue decreased from subscription downgrades
Let’s look at a real example. Your business starts with $10,000 in Monthly Recurring Revenue and loses $1,000 from cancellations or downgrades. This gives you a GRR of 90%. On top of that, GRR cannot exceed 100% since it doesn’t include expansion revenue. This makes it a reliable measure of your core revenue stability.
What is Net Revenue Retention (NRR)?
Net Revenue Retention (NRR) is a complete metric that shows how well companies keep customers and grow revenue from them over time. This metric measures both customer loyalty and account expansion together.
Read More on: What is Net Revenue Retention
Definition of NRR: The Big Picture Metric
NRR measures how well you maintain and grow revenue from existing customers. The metric tracks several revenue changes:
- Revenue from existing customers
- Expansion through upsells and cross-sells
- Losses from downgrades
- Revenue reduction from churned customers
An NRR above 100% shows that a business can grow without acquiring new customers. Small and medium SaaS businesses aim for 90% NRR, while larger SaaS companies need at least 125%.
Formula: How to Calculate NRR
The NRR calculation combines different revenue components to show customer value clearly. Here’s the formula:
NRR = [(Starting MRR + Expansion MRR - Churned MRR - Downgrade MRR) / Starting MRR] x 100
Let’s look at a real example. A company starts with $100,000 in monthly recurring revenue. They lose $5,000 to customer churn and $2,000 in downgrades but gain $8,000 from expansions. Their NRR would be 101%. Companies can calculate this metric monthly, quarterly, or yearly based on their needs.
Comparing GRR and NRR: What’s the Difference?
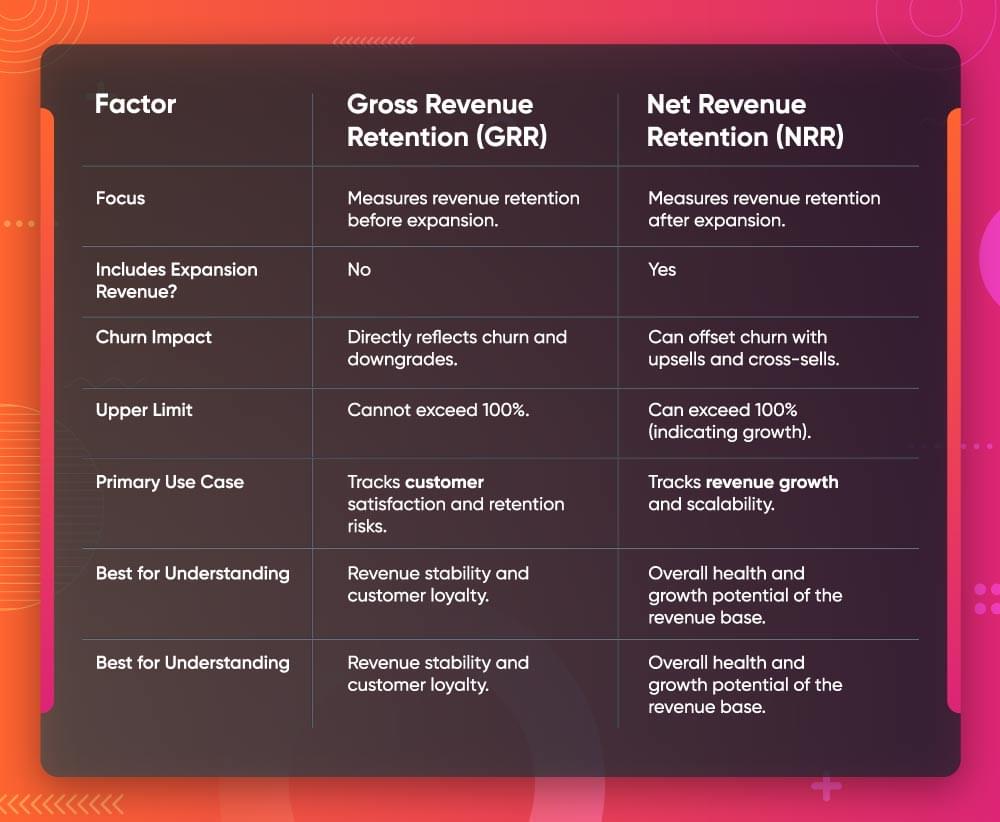
The main difference between GRR and NRR shows up in what they measure. These metrics track customer revenue but each tells its own story about business performance. While Gross Revenue Retention (GRR) measures your ability to maintain revenue from existing customers, Net Revenue Retention (NRR) tells a broader story by including expansion revenue. In fact, successful companies typically maintain a GRR of at least 90% and aim for an NRR above 104%.

GRR vs. NRR: Measuring Customer Stability vs. Growth
GRR shows revenue stability by tracking existing revenue streams. NRR offers a broader view that includes expansion revenue along with retention. This makes NRR a better indicator of business health because it shows both customer loyalty and potential for growth.
Why NRR Can Be Greater Than 100%, but GRR Cannot
GRR has a mathematical limit of 100% since it doesn’t count expansion revenue. NRR can go beyond 100% when expansion revenue grows faster than losses from churn and downgrades. To name just one example, see how a company that keeps all its customers and achieves big upsells might reach 120% NRR or higher. This is a big deal as it means that the business is growing.
The Role of Churn, Expansion, and Contraction in GRR and NRR
Each metric responds to revenue changes differently:
| Revenue Component | Impact on GRR | Impact on NRR |
|---|---|---|
| Churn | Decreases | Decreases |
| Contraction | Decreases | Decreases |
| Expansion | No Impact | Increases |
NRR proves especially valuable to businesses with strong upsell opportunities, though GRR is a vital measure of core revenue stability. Looking at both metrics together reveals your revenue’s health and growth path clearly.
The Evolution of Revenue Retention Metrics
Revenue tracking has changed dramatically with the rise of subscription-based business models.
Traditional Revenue Tracking Methods
Companies used Generally Accepted Accounting Principles (GAAP) to recognize revenue. This framework focused on single-point transactions instead of recurring revenue streams. The old metrics couldn’t capture customer relationships and their long-term value.
Modern Revenue Retention Framework
Companies now track multiple metrics at once to learn about their business performance. Research shows that businesses using modern retention frameworks see a 25-95% increase in profitability with just a 5% boost in customer retention. The modern approach highlights:
| Traditional Focus | Modern Focus |
|---|---|
| Single Transactions | Recurring Revenue |
| Total Revenue | Customer Lifetime Value |
| Annual Reports | Up-to-the-minute Data Analysis |
| General Metrics | Cohort-specific Analysis |
Impact of Digital Transformation
Digital transformation has altered how companies measure success. Recent data shows 89% of large companies worldwide have launched digital transformation initiatives. Yet they’ve only captured 31% of their expected revenue lift. Digital leaders achieve 8.1% annual shareholder returns while laggards see just 4.9%.
Using Cohort Analysis to help review retention
Cohort analysis is a vital tool that helps companies understand customer behavior patterns. This method groups users by shared characteristics and helps businesses spot trends to optimize retention strategies. Companies can cut churn rate by up to 3x through effective cohort analysis.
Which Metric is More Important: GRR or NRR?
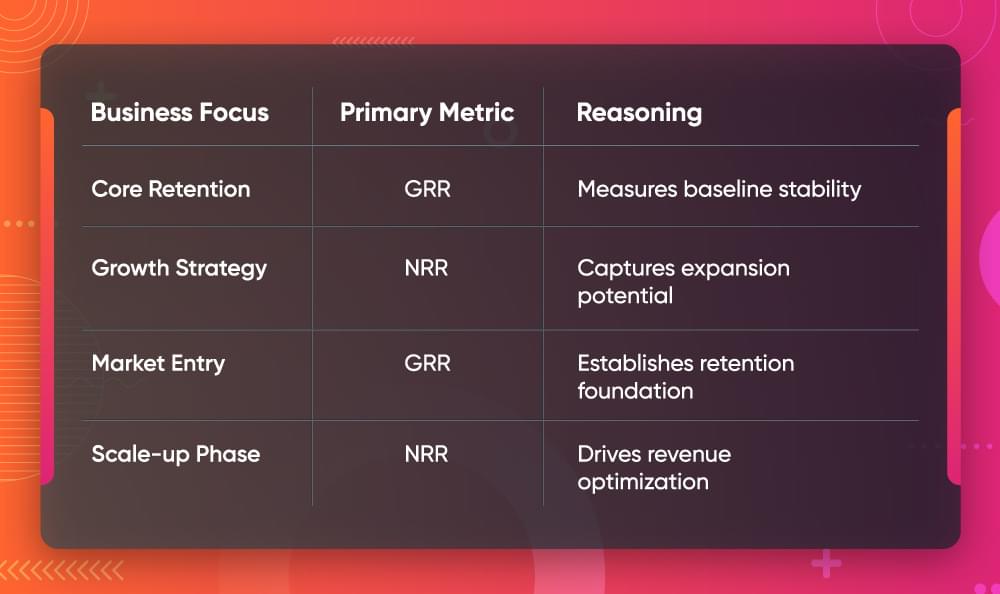
Your choice between GRR and NRR as your main metric depends on your business goals and growth stage. Both metrics give you different insights that help shape your strategic decisions.
GRR needs your full attention in these scenarios:
- Early-stage companies establishing their core customer base
- Businesses focusing on service stability assessment
- Companies that want to strengthen customer loyalty programs
Related Read:
Customer Loyalty Rewards for Halloween
NRR becomes vital when you’re:
- Looking to maximize revenue growth from existing customers
- Measuring upsell and cross-sell effectiveness
- Finding the right balance between customer acquisition and retention

Using both metrics together works best. A high GRR signals strong customer satisfaction and product stickiness and serves as an early warning system for customer satisfaction or service quality issues. NRR above 100% shows successful growth from upsells and expansions and helps you learn about growth potential without depending on new customer acquisition.
These metrics work together to reveal risks you might miss by looking at just one metric. To name just one example, see how high NRR could hide too much churn, as big expansion revenue might mask underlying retention problems. You’ll get the most detailed view of your revenue health by tracking both metrics together.
How to Improve Net Revenue Retention?
Net Revenue Retention growth depends on customer-focused initiatives and revenue optimization techniques working together. Research shows a mere 5% boost in customer retention rates can increase profits by 25-95%.
The path to better NRR starts with investment in customer success teams. These teams build positive relationships and help customers get their predicted value. Gartner’s research reveals that only 15% of customer interactions add real value.
A reliable strategy consists of three key components:
| Strategy Component | Impact on NRR | Implementation Focus |
|---|---|---|
| Customer Experience | Reduces Churn | Personalized Support |
| Product Engagement | Drives Expansion | Feature Adoption |
| Revenue Optimization | Maximizes Value | Usage-Based Pricing |
Product engagement is a vital part of improving NRR. High engagement levels often relate to more upselling opportunities. Customers realize maximum value from their investment through individual-specific onboarding processes and interactive tutorials.
Strong engagement paves the way for expansion through smart upsells and cross-sells. Companies achieve this by offering premium feature trials or implementing usage-based pricing that matches customer’s value creation.
Customer feedback collection remains essential to NRR improvement. Regular surveys and Net Promoter Score (NPS) tracking help spot problems before they cause churn. On top of that, loyal customer rewards through discounts, gifts, or free upgrades build lasting relationships and encourage account growth.
Related: What is a good NPS score
Benchmarks for GRR and NRR Across Industries
Recent industry data shows clear patterns in revenue retention metrics for different sectors. The median Net Revenue Retention (NRR) stands at 102%, and Gross Revenue Retention (GRR) reaches 91%.
A company’s size2 has a big impact on retention rates. Companies with Annual Contract Values (ACV) over $25,000 reach a median GRR of 93%. This is higher than the 90% achieved by companies with lower ACVs. Top-quartile companies with ACVs over $100,000 show impressive NRR rates between 118-120%.
Related: B2B SaaS Benchmarks
| Company Size | Typical GRR | Typical NRR |
|---|---|---|
| Enterprise (>$25k ACV) | 93% | >103% |
| Mid-Market ($12k ACV) | 80% | 100-103% |
| SMB (<$12k ACV) | 85% | 98-100% |
Industry standards divide GRR performance into three tiers:
- 95% and above: Excellent performance
- 85% to 95%: Decent range for SaaS companies
- 70% to 85%: Concerning level, especially if trending downward
Companies with NRR rates above 110% perform better than their competitors. Manufacturing companies improve retention through custom solutions. Healthcare providers focus on patient involvement to maintain steady revenue streams. Retail businesses use membership programs to boost their NRR.
How to Calculate and Track Both Metrics Together
GRR and NRR metrics together give you a better picture of your revenue health than looking at either one alone. You’ll need your Monthly Recurring Revenue (MRR) from the start of the period. The calculation works like this:
GRR = [(Beginning MRR - Churn MRR - Downgrade MRR) / Beginning MRR] x 100
The NRR calculation follows a similar pattern: NRR = [(Beginning MRR - Churn MRR - Downgrade MRR + Expansion MRR) / Beginning MRR] x 100
Modern software solutions now automate these calculations through built-in dashboards. These tools blend with your billing systems and CRM software to ensure accurate data flow and deliver live analytics.
| Tracking Component | Purpose | Implementation |
|---|---|---|
| Monthly Analysis | Short-term trends | Regular revenue reviews |
| Quarterly Review | Strategic planning | Cohort performance |
| Annual Assessment | Long-term patterns | Year-over-year growth |
We analyze retention over 12-month periods because this time frame works well for both annual and monthly subscriptions. You can also break down the analysis by specific markets, customer segments, or seasonal patterns. This integrated view helps identify areas where retention strategies need adjustment while maintaining clear visibility of revenue performance.
How Often Should GRR and NRR Be Reviewed?
Revenue retention metrics shape how businesses plan their strategy. Your business model and available data determine the best time to review these metrics.

Smart businesses look beyond single data points when they analyze these metrics. Trend analysis over time gives better insights than just looking at monthly or quarterly numbers. Monthly or quarterly calculations are enough for newer businesses that don’t have years of data yet.
Using both metrics together has clear benefits. GRR shows how loyal customers are and reveals core revenue stability. NRR adds growth indicators to complete the picture. This combined approach lets companies:
- Keep stable revenue while growing
- Create accurate forecasts and set achievable targets
- Learn if customer success strategies work
Regular reviews of both metrics help catch problems early before they affect business results. Many companies build these reviews into their regular business checks to keep existing customers happy while increasing their value. Multi-year deals need extra attention since they can hide real renewal rate problems.
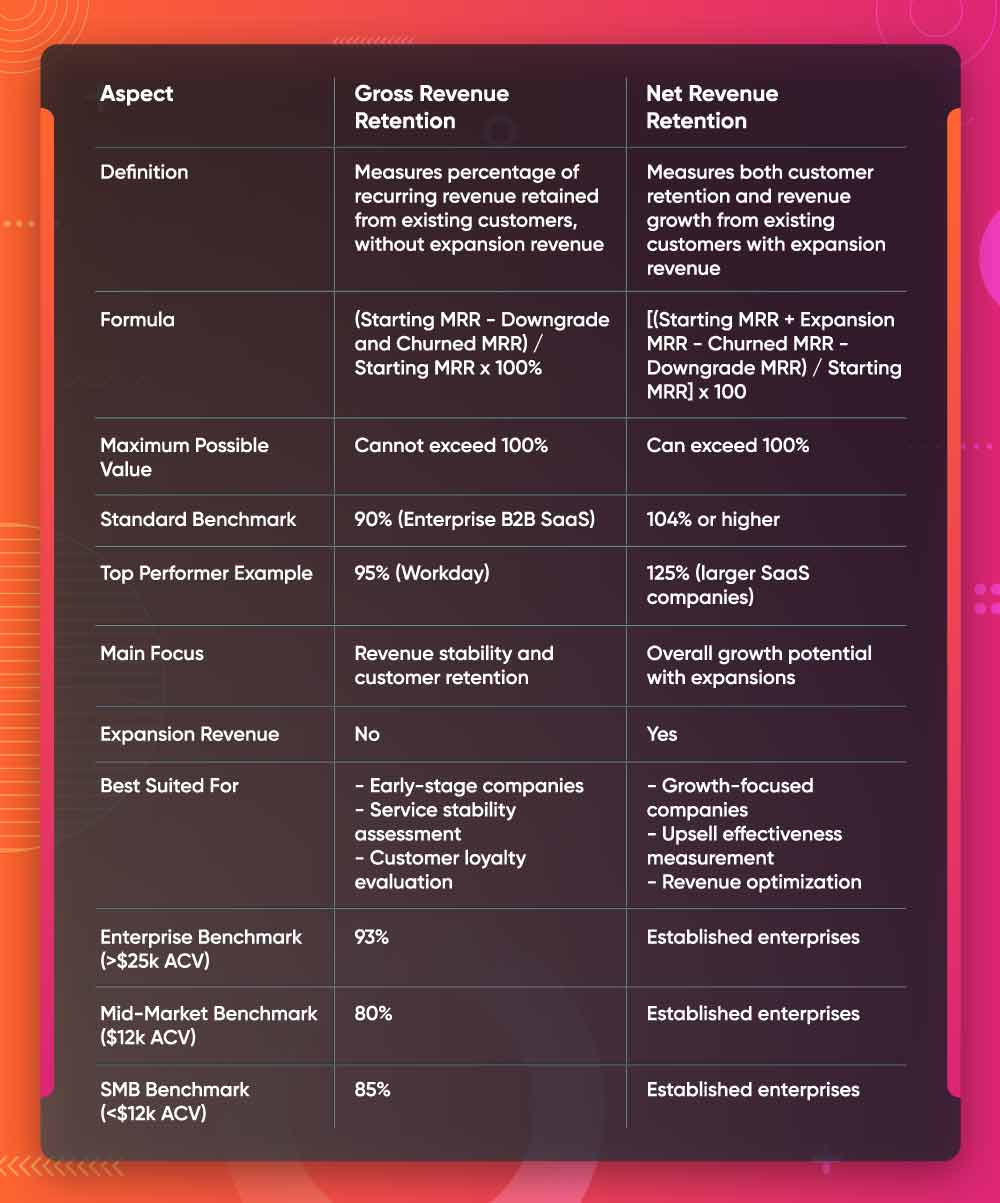
Summary Table: Gross Revenue Retention Vs. Net Revenue Retention

Conclusion
GRR and NRR teach us a lot about your business’s health and growth potential. These metrics tell different but connected stories. GRR shows how stable your core revenue is, and NRR shows how well you grow through existing customers.
Smart companies keep an eye on both metrics at once. They know strong GRR creates the foundation for healthy NRR. You need to focus equally on keeping customers happy and finding ways to grow their accounts.
GRR and NRR together show how well your business performs. Your success in today’s competitive market depends on keeping existing revenue steady while finding new ways to expand.
Related Read: Gross Vs Net
FAQs
Q1. What’s a good benchmark for GRR and NRR?
For most businesses, a Net Revenue Retention (NRR) of 102% and a Gross Revenue Retention (GRR) of 91% are considered median benchmarks. However, these figures can vary based on factors such as industry, company size, and market conditions.
- GRR: ~90% or higher.
- NRR: >100%, with 120%+ being ideal.
Q2. How do Net Revenue Retention (NRR) and Annual Recurring Revenue (ARR) differ?
While ARR measures the total recurring revenue a company earns annually, NRR focuses on how well a company retains and grows revenue from its existing customer base. NRR includes factors like expansions, downgrades, and churn, providing a more dynamic view of customer value over time.
Q3. Is it possible for Gross Revenue Retention (GRR) to exceed 100%?
No, GRR cannot exceed 100%. Unlike Net Revenue Retention, GRR only considers downgrades and churn, excluding expansion revenue. This makes it a more conservative metric that reflects core revenue stability rather than growth potential.
Q4. Can NRR exceed GRR?
Yes, because NRR includes expansion revenue, whereas GRR does not.
Q5. How often should you track GRR and NRR metrics?
Track them monthly, quarterly, and annually, depending on your business model. Monthly reviews are beneficial for early-stage companies, while quarterly assessments suit growth-phase businesses. Established enterprises may find annual reviews sufficient for identifying long-term patterns. Regular monitoring helps in making informed strategic decisions and identifying potential issues early.


