



What Is a Good NPS Score? 2026 Benchmarks by Industry

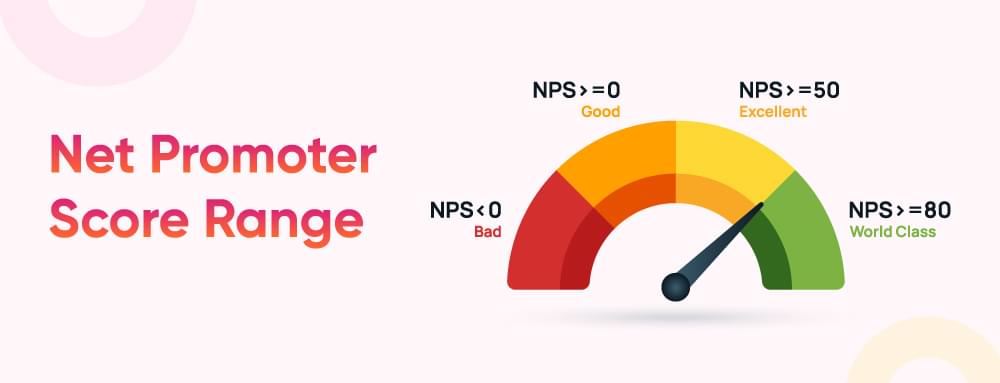
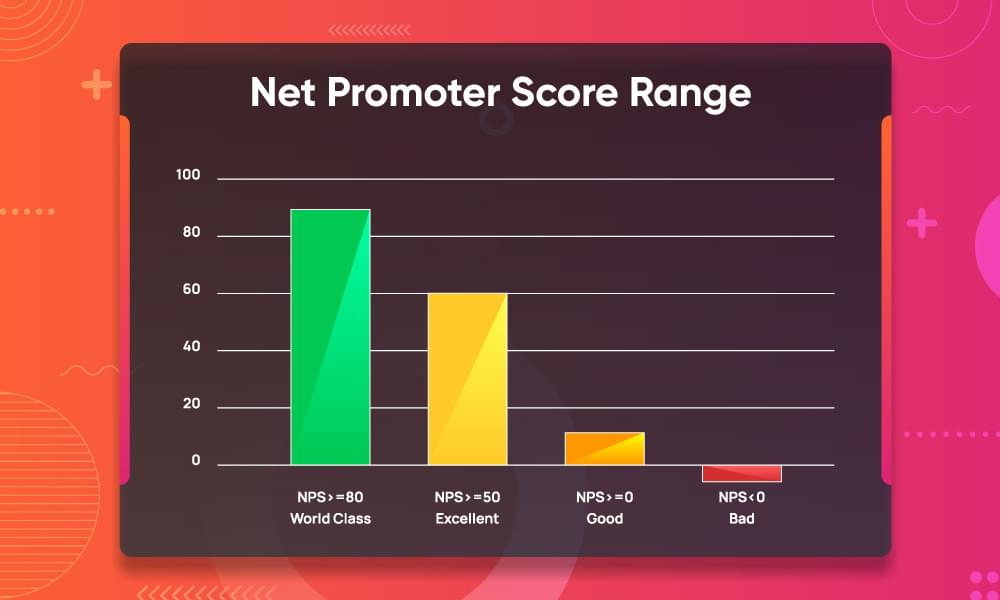
A good NPS score is anything above 0, because it means you have more promoters than detractors. Above 20 is favourable, 50 or higher is excellent and 80 or higher is world class, according to the Bain & Company framework. Industry averages in Retently’s 2026 benchmark run from 26 to 68, so compare your score with your own industry before judging it.
| NPS range | What it means |
|---|---|
| Below 0 | Needs work: more detractors than promoters |
| 0 | Neutral: promoters equal detractors |
| 1 to 19 | Good: more promoters than detractors |
| 20 to 49 | Favourable |
| 50 to 79 | Excellent |
| 80 and above | World class |
One precious quality that an organization wears like a crown is its Customer loyalty. Organizations that struggle to improve it understand its worth.
Measuring customer loyalty with the Net Promoter Score (NPS) is a method Fred Reichheld of Bain & Company introduced in 2003. This leads us to our topic today: what is a good Net Promoter Score?
Net Promoter Score (NPS) gauges the likelihood that customers will refer your product, service, or business to others. 1
Related Read: What is net promoter score
It depicts customer loyalty in numbers. The NPS is calculated from responses received to this question:
“On a scale from 0 to 10: How likely are you to recommend our company/product/service to a friend or colleague?”
Depending on their responses, we place customers into three categories:
Promoters (Score 9-10): These are loyal enthusiasts who will continue buying from your company and actively recommend you to others.
Passives (Score 7-8): Satisfied but not enthusiastic customers. They could easily switch to a competitor if a better offer comes along.
Detractors (Score 0-6): Unhappy customers who could damage your brand through negative word-of-mouth or leave your business altogether.
The NPS is then calculated by subtracting the percentage of Detractors from the percentage of Promoters.
The net promoter score, ranging from -100 to +100, helps companies gauge the overall perception of their brand. But understand what qualifies as a good NPS score to understand its full potential.
Related Read: How to Calculate Net Promoter Score
What is a Good NPS Score?
Any NPS above 0 is good, above 20 is favourable, 50 or higher is excellent and 80 or higher is world class, according to Bain & Company’s framework. A score below 0 needs work, because you have more detractors than promoters. (Qualtrics quotes the same framework.)
Those bands are a starting point, not a verdict. What counts as good also depends on your industry, your region, your company size and who you survey. That is why the benchmarks by industry further down matter more than any single global number.
How to Calculate Your NPS Score
The formula is one line:
NPS = % Promoters - % Detractors
Passives count toward your total responses but are left out of the subtraction. That is deliberate: they are not driving referrals and they are not driving people away.
A worked example. You send the survey to your customer base and get 400 responses back:
| Group | Score | Responses | Share of responses |
|---|---|---|---|
| Promoters | 9-10 | 220 | 55% |
| Passives | 7-8 | 100 | 25% |
| Detractors | 0-6 | 80 | 20% |
NPS = 55 - 20 = +35.
Two things to hold on to. The result is a whole number between -100 and +100, not a percentage, so writing “35% NPS” is wrong. And the arithmetic hides sample size: +35 from 400 responses and +35 from 9 responses are not the same finding. Below roughly 100 responses, treat the number as directional only.
Transactional vs Relational NPS
Most teams run one of two programmes and the scores are not comparable.
- Relational NPS asks about the overall relationship, usually quarterly or twice a year. This is the number you benchmark against your industry and track over time.
- Transactional NPS fires after a specific event: onboarding finishing, a support ticket closing, a renewal. It tells you which moment in the journey is hurting, not how customers feel about you overall.
Transactional scores usually run higher than relational ones because you are catching people right after a resolved interaction. Keep the two series separate. Mixing them is the most common reason an NPS trend looks like it moved when nothing changed.
Net Promoter Score Range
How to interpret your NPS score better, read below:
- Positive NPS is Good (NPS > 0)
Any positive score (above 0) means you have more promoters than detractors, which is a good start.
- NPS of 50 or higher is Excellent (NPS >= 50)
An NPS of 50 or higher is generally considered Excellent. It indicates that your business has more promoters than detractors.
- NPS of 80 or higher is World-Class (NPS >= 80)
NPS of 80 or above is world-class, it is superb. It indicates that you have a high number of promoters and that your efforts to improve customer loyalty and retention in your organization are blooming.
- Negative NPS is Bad (NPS < 0)
Negative NPS is a serious warning sign. It indicates that the majority of your customers are having a bad experience with your business and are open to moving to your competitors at any time. And that the company really needs to work and improve the reasons for the high detractor count.
NPS Rating Scale vs NPS Score
Two different numbers get called “the NPS rating”, and they are easy to mix up.
- The rating is what each customer gives you: a whole number from 0 to 10 in answer to “How likely are you to recommend us?” A 9 or 10 makes them a promoter, a 7 or 8 a passive, and 0 to 6 a detractor.
- The score is what you calculate from all the ratings together: the percentage of promoters minus the percentage of detractors. It runs from -100 to +100.
So a customer can rate you 8, but a company cannot “score 8 out of 10” on NPS. When someone quotes an NPS, they mean the score on the -100 to +100 scale.
How to Know if You Scored the Good NPS
Opting to score a 100 NPS is most likely an impossible target, especially for bigger companies, and is also an unrealistic goal.
There are four different approaches to help understand if your NPS is a good NPS or not. Each approach provides a different type of analysis; choose whichever suits you better. If you ask me, I would suggest considering the fourth approach above all others.
Absolute NPS Performance Check
“Absolute NPS uses the NPS scores from all industries as a standard”
Every industry has its own industry NPS standard that again keeps on changing as the industries observe their highs and lows. What’s considered good in one industry might be an average NPS in another.
So the absolute NPS uses the NPS scores from all industries as a standard of good or bad NPS and then compares it with your business NPS.
To interpret the results, follow the criteria mentioned in Net Promoter Score range.
I hope you can see that the process and results from absolute NPS performance check are messy and unreliable. This is because every business runs its NPS system slightly differently than others. Plus, other factors like demographics, regions, industry type, etc affect a business’s NPS.
For example, if you are in the tech industry, which often sees higher NPS scores worldwide as compared to traditional industries like airlines or utilities, when you take the average NPS of all the industries, your business NPS might fall into the world-class range. This could be because the average score of all the industries might be lower than yours.
Checking Relative NPS Performance
“Compare your NPS to Competitors”
Second method to monitor if your NPS figure is a good NPS, compare it to your Industrial Average Net Promoter Score—compare your NPS to NPS of your competitors.
Use these industries as a relative benchmark for your company. With a relative score to compare against, you are getting closer to a comparison that makes more sense.
But do you think beating the industry NPS benchmark is your goal? Can your company really benefit from wearing the “better than others” badge? I do not think so. The NPS goal is to serve the customers and improve revenue retention.
Recommended Read:
Be Your Own Benchmark
“Compare your current NPS from last NPS”
The most accurate comparison of the NPS improvement check is your last NPS vs. the latest NPS.
The yardstick to check if you scored a good NPS or a bad NPS is to see “if the NPS is growing”. One score higher than the last score is good NPS. Otherwise, you better sit down and see what happened and why.
Remember, NPS is not your business’s beauty face; it actually tells the inside story of your business and your customers—the state of your customer relationships.
The real power of NPS is not only to calculate customer loyalty but also its ability to quickly act and grow in the form of revenue, for example via referrals, up-sells or cross-sells, and retention marketing tactics.
When Revenue is Your Benchmark: Tie the NPS to Revenue
This approach to assessing if your NPS is good or bad is my personal favorite, and I will recommend you use it. You will be surprised. It is about tying your Net Promoter Score to your revenue. Let me explain how it is done.
Once you have received the NPS survey results, find the answer to this question:
“How much current revenue is the passives and detractors are producing?”
For example, you received the NPS survey score, and it is 75. It falls in the Excellent NPS score range (not many bigger companies score it often). However, while calculating for the answer to above question, you found out that one of your big customers, responsible for 17% of your revenue, has churned, and joined a competitor. Will you still think that your NPS score is a good score? I guess not.
This method of evaluating good NPS magically surfaces two more questions “Who is filling out your NPS surveys?” and secondly, “Why your larger customers are not your promoters?”
Net Promoter Score Benchmarks
The most useful comparison is your own industry. Retently’s 2026 benchmark, built from its own customers’ survey data, puts every industry it tracks above zero, with averages from 26 to 68. It splits the results into B2B and B2C.
B2B NPS Benchmarks (2026)
| Industry | Average NPS |
|---|---|
| Consulting | 68 |
| Technology & Services | 63 |
| Digital Marketing Agency | 49 |
| Construction | 42 |
| Logistics & Transportation | 42 |
| B2B Software & SaaS | 41 |
B2C NPS Benchmarks (2026)
| Industry | Average NPS |
|---|---|
| Financial Services | 68 |
| Ecommerce & Retail | 61 |
| Property Management | 47 |
| Insurance | 46 |
| Communication & Media | 39 |
| Healthcare | 37 |
| Internet Software & Services | 26 |
Source: Retently, “What is a Good Net Promoter Score? (2026 NPS Benchmark)”, published April 2026. Figures from other surveys differ because each one samples different companies.
Read these as ranges, not targets. A +45 in Communication & Media is above that industry’s average; the same +45 in Consulting is well below it. That is the whole argument for benchmarking against your own industry rather than a global figure.
The same industry can also move a lot from one year to the next. Retently reports that Insurance fell from 80 to 46 and Healthcare from 53 to 37 between its 2025 and 2026 benchmarks. Treat any benchmark as a snapshot, and check the year before you quote it.
To read more about Net Promoter Score, how to improve NPS and Apple’s case study click here.
What Is a Good NPS Score for SaaS?
For a software company, a score in the 40s is roughly average and anything above 50 is strong. Two 2026 benchmarks put SaaS in that range:
| Source | Segment | NPS |
|---|---|---|
| Retently 2026 NPS Benchmark | B2B Software & SaaS average | 41 |
| CustomerGauge NPS Benchmark Report: Decade Edition (2026) | Software and technology, 2026 survey | 51 |
| CustomerGauge NPS Benchmark Report: Decade Edition (2026) | Software and technology, blended across a decade | 47 |
CustomerGauge calls a SaaS NPS of 47 or higher good. Its figures come from B2B CX programmes reporting their own scores, so they lean towards companies that already run NPS seriously. That is one reason it reads higher than Retently’s 41.
Who answers the survey changes the number too. Gainsight’s Customer Success Index 2022, as cited by Retently, found a median NPS of 36 among software users and an average of 46 among executive buyers. If your survey mostly reaches admins and buyers, your score will look better than the experience of the people who use the product every day.
For a subscription business, the detractors in that data are the customers most likely to cancel. An NPS survey tells you how many there are. It does not tell you what finally makes one of them leave. Asking at the moment they cancel does, which is what cancellation feedback in Churnfree is for. Read it next to your B2B SaaS churn benchmarks so you are comparing how customers feel with what they actually do.
How to Improve Your NPS Score
The score itself does not move. The experiences behind it do. In rough order of payback:
- Close the loop on detractors within 48 hours. A detractor who gets a real reply from a human is the single most convertible group you have. Ask what happened, fix it if you can, and tell them what changed.
- Read the follow-up answers, not the numbers. The “why did you give that score” field is where the actual product roadmap is. Tag responses by theme and count the themes.
- Fix the moment, not the mood. If transactional NPS drops after onboarding, the problem is customer onboarding, not customer sentiment in general.
- Watch passives as churn risk. Passives are satisfied and unattached. They are the group most likely to leave quietly when a competitor makes an offer, which is why they belong in your customer health score.
- Give promoters something to do. Referral programmes, review requests, case studies. A promoter you never ask is a promoter you wasted.
- Ask the leavers too. The people who churned will not answer an NPS survey, so run a separate exit question set. We list the ones worth asking in top six questions to ask churned customers.
An NPS survey tells you how customers feel. A cancel flow tells you what they do about it. Churnfree catches the customer at the moment they click cancel, asks why, and offers a pause or a discount before they go, so the detractor you would have seen in next quarter’s survey turns into a save this week. Keep that offer easy to decline. The federal FTC click-to-cancel rule was vacated in 2025, but state cancellation laws and ROSCA enforcement still expect a simple online way to cancel, so a save offer should never block the exit.
Conclusion: It’s Time for Action
Even if your NPS is exactly where you want it to be, get into action to improve it. First, focus on the feedback from detractors and Passives. Detractors often tell you what’s not working. Find out whether it’s your customer service, product features, or pricing. Address these concerns, and you might convert them into Passives or even Promoters.
Then engaging with your promoters is an even better idea. They are your brand ambassadors; acknowledge their loyalty and reward them—perhaps through referral programs, special offers, or exclusive content. They can bring you new customers and improve your customer acquisition rate, so it’s a win win situation for both parties. Good Luck!
FAQs About NPS Scores
What is a good NPS score?
Anything above 0 is good, because you have more promoters than detractors. Above 20 is favourable, 50 or higher is excellent and 80 or higher is world class. Compare it with your industry average in the benchmark tables above before you judge it.
How do I calculate my NPS score?
Subtract the percentage of detractors (0-6) from the percentage of promoters (9-10). Passives (7-8) are excluded from the subtraction but counted in your total responses. The result is a number between -100 and +100.
Is 72 a good NPS score?
Yes. A 72 is excellent (50 or higher) and close to world class (80 or higher). It is also above every industry average in Retently’s 2026 benchmark, where the highest is 68.
Is 27 a good NPS score?
Yes. It is above 0 and above 20, so it is favourable on Bain’s framework. Compare it with your industry average, because in some industries 27 is below the norm.
Is NPS 70 good?
Yes, 70 is excellent. Note that NPS is a score, not a percentage, so “70% NPS” is not the right way to write it.
Is NPS a percentage?
No. It is an index between -100 and +100. Writing it with a percent sign is a common error and makes comparisons confusing.
How many responses do I need for NPS to be reliable?
As a rule of thumb, at least 100 responses before you read the number as a trend and several hundred before you slice it by segment. Under that, one or two detractors can swing the score by double digits. With 100 responses, your score can be off by up to about 20 points either way.
How often should I run an NPS survey?
Relational NPS quarterly or twice a year. Transactional NPS after specific events, continuously. Surveying the same customers more often than quarterly usually just lowers your response rate.
What is the difference between NPS, CSAT and CES?
NPS measures likelihood to recommend, so it tracks loyalty. CSAT measures satisfaction with one interaction. CES measures how hard the customer had to work. Use CSAT and CES to diagnose a moment and NPS to track the relationship.
Does a high NPS mean low churn?
Not on its own. Promoters churn when pricing changes or a payment fails, which is involuntary churn rather than a loyalty problem. Read NPS alongside your churn rate and retention metrics, never instead of them.
Want to stop the detractors before they cancel? Start your 14-day free trial, no credit card required, and turn your cancel page into a retention step.