



CSAT vs NPS: Key Differences and When to Use Each

CSAT (customer satisfaction score) measures how satisfied a customer is with a specific interaction or product, so it shows how one moment went. NPS (Net Promoter Score) measures how likely a customer is to recommend you, so it tracks loyalty to the whole relationship. Most SaaS teams need both, used at different points in the customer journey.
This guide covers how each metric works, how to calculate it, where Customer Effort Score (CES) fits, and how to choose the right survey for each moment, including the one moment most feedback programs miss: the cancellation.
CSAT vs NPS at a Glance
| CSAT | NPS | |
|---|---|---|
| What it measures | Satisfaction with a specific interaction, feature or product | Loyalty to the company as a whole |
| Typical question | “How would you rate your overall satisfaction with the [service] you received?” | “How likely are you to recommend us to a friend or colleague?” |
| Scale | 1 to 5 (very unsatisfied to very satisfied) | 0 to 10 |
| Score | Percentage of satisfied responses (4 or 5), from 0% to 100% | % promoters minus % detractors, from minus 100 to plus 100 |
| Time frame | Short term, “here and now” | Long term, relationship level |
| Best for | Support tickets, onboarding steps, feature launches | Tracking loyalty over time, predicting churn and referrals |
| Main weakness | Response bias and a narrow view of one moment | Hard to act on without a follow-up question |
The short version: use CSAT to find out whether a specific touchpoint worked, and use NPS to find out whether the relationship is healthy. Qualtrics puts the difference this way: “CSAT measures customer satisfaction with a product or service, whereas Net Promoter Score (NPS) measures customer loyalty to the organization” (Qualtrics).
What Is CSAT?
CSAT, or customer satisfaction score, measures how satisfied customers are with a product, service or interaction. You ask a single question right after the moment you want to measure, such as a support conversation, an onboarding call or the first use of a new feature.
The most common version uses a five point scale:
- Very unsatisfied
- Unsatisfied
- Neutral
- Satisfied
- Very satisfied
How to Calculate CSAT
CSAT is usually expressed as the percentage of respondents who chose one of the top two answers:
CSAT = (number of 4 and 5 responses / total responses) x 100
For example, if 200 customers rate their support conversation and 170 of them pick “satisfied” or “very satisfied”, your CSAT is 85%.
Qualtrics recommends this top two method and notes that using the two highest values on feedback surveys “is the most accurate predictor of customer retention” (Qualtrics).
Strengths and Weaknesses of CSAT
CSAT is quick to answer and easy to tie to a specific team or touchpoint.
Its limits come from the same focus. A customer can be satisfied with every support ticket and still cancel because the product never solved their core problem. CSAT is also prone to response bias: Qualtrics points out that people who respond “are likely to be those who have had a very positive or very negative experience,” while people who feel neutral are less likely to answer (Qualtrics).
What Is NPS?
Net Promoter Score measures customer loyalty with one question: “How likely are you to recommend us to a friend or colleague?” Customers answer on a scale from 0 to 10. Fred Reichheld of Bain & Company introduced the idea in the Harvard Business Review article “The One Number You Need to Grow“ in December 2003, arguing that many satisfaction tools were measuring the wrong thing.
Respondents fall into three groups, as defined by Bain’s Net Promoter System (Net Promoter System):
- Promoters (9 to 10): loyal, enthusiastic customers who are more likely to stay and to buy more over time. Bain says they account for more than 80% of referrals in most businesses.
- Passives (7 or 8): “passively satisfied” customers. Bain says their repurchase and referral rates are as much as 50% lower than those of promoters, and they may defect if a competitor catches their eye.
- Detractors (0 to 6): unhappy customers who, according to Bain, account for more than 80% of negative word of mouth and have high rates of churn and defection.
How to Calculate NPS
NPS = % promoters minus % detractors
Passives count toward the total number of responses but not toward either group. For example, if 300 customers respond and 150 are promoters, 90 are passives and 60 are detractors, you have 50% promoters and 20% detractors, so your NPS is 30.
Because it is a difference between two percentages, NPS ranges from minus 100 (everyone is a detractor) to plus 100 (everyone is a promoter). It is reported as a whole number, not a percentage. For guidance on what counts as a strong result, see our post on what a good NPS score is, and for the full background, what Net Promoter Score is.
Strengths and Weaknesses of NPS
NPS gives you a single, relationship level number that is easy to trend quarter over quarter and easy to share with leadership. It also gives customer success teams a simple way to segment accounts: detractors need attention, passives need a reason to stay, and promoters can be asked for referrals.
The weakness is that the score alone does not tell you what to fix. A drop from 40 to 32 could be caused by a pricing change, a bug, a slow support queue or a competitor’s launch. Always pair the NPS question with an open follow-up such as “What is the main reason for your score?”
Key Differences Between CSAT and NPS
1. Scope: One Moment vs the Whole Relationship
CSAT is transactional. It measures a specific interaction, so its results point to a specific team or process. NPS is relational. It captures how a customer feels about your company overall, including product, price, support and brand.
2. Time Horizon: Short Term vs Long Term
Qualtrics describes CSAT as targeting a “here and now” reaction to a specific interaction (Qualtrics). NPS moves more slowly and is better at showing the direction of the relationship over months.
3. What Each Predicts
High CSAT on a support ticket tells you the ticket went well. It does not guarantee renewal. NPS is designed as a loyalty signal, which is why Bain links promoters to repeat purchases and referrals and detractors to churn (Net Promoter System). In SaaS, NPS is often one input in a customer health score alongside usage and support data.
4. Who Acts on It
CSAT results usually belong to the team that owns the touchpoint: support, onboarding or a product squad. NPS results are usually owned by customer success or leadership, and they feed account reviews and quarterly business reviews.
5. Survey Timing
CSAT goes out immediately after the interaction, while the experience is fresh. NPS goes out on a schedule or at lifecycle points like a few weeks before renewal. Avoid sending NPS right after a support ticket, or you will get a CSAT answer to an NPS question.
Where Customer Effort Score (CES) Fits
Many teams compare CSAT vs NPS vs CES, because CES fills a gap the other two leave. Customer Effort Score measures how easy it was for a customer to get something done: resolve an issue, complete a setup step or find an answer. Qualtrics notes that CES surveys typically ask, on a scale from “very easy” to “very difficult”, how easy it was to interact with the company (Qualtrics).
Effort matters for retention. Qualtrics quotes research from the book The Effortless Experience: “96% of customers with a high-effort service interaction become more disloyal compared to just 9% who have a low-effort experience” (Qualtrics).
In a SaaS context, CES is most useful after:
- Setup and integration steps during onboarding
- Support tickets that took more than one contact to resolve
- Self-serve tasks like changing plans, adding seats or updating billing details
A simple way to remember all three: CES asks “was it easy?”, CSAT asks “was it good?”, and NPS asks “would you vouch for us?”
When to Use CSAT vs NPS
Use this as a starting point, then adjust for your product and customer base.
| Moment in the customer journey | Best metric | Why |
|---|---|---|
| After a support conversation closes | CSAT (or CES) | Measures that interaction and the agent or process behind it |
| After an onboarding milestone | CES or CSAT | Shows whether setup is getting in the way of value |
| After a new feature launch | CSAT | Tells the product team whether the feature landed |
| 60 to 90 days after signup | NPS | First read on the relationship once the customer has real experience |
| Quarterly or twice a year | NPS | Tracks loyalty over time and segments accounts |
| A few weeks before renewal | NPS plus a follow-up question | Flags detractors while there is still time to act |
| At the cancellation step | Cancellation survey | Neither CSAT nor NPS tells you why a customer is leaving right now |
A common B2B SaaS setup is CSAT on every support ticket, CES after key onboarding steps, and a relationship NPS once or twice a year. Smaller subscription businesses can start with NPS and one CSAT survey on support. For more ways to gather and use feedback across the lifecycle, see our guide to customer feedback.
How to Use CSAT and NPS Together
The two metrics are most useful when you read them side by side.
High CSAT, low NPS. Individual interactions go well, but customers are not loyal. The problem is usually the product, the price or the fit, not the service.
Low CSAT, high NPS. Customers love the product but are frustrated by specific touchpoints. Fix the processes behind the low CSAT scores before the frustration spreads to the relationship.
Both falling. Treat this as an early churn warning. Segment by plan, tenure and account size to find where the drop is concentrated.
Both high, churn still rising. Your surveys are probably missing the customers who leave. Unhappy customers often stop answering surveys well before they cancel, which is why the cancellation step matters.
A few practical rules make both metrics more reliable:
- Always ask why. Add one open question after every score. The comments are where the fixes come from.
- Segment before you average. A company wide NPS can hide a detractor problem in one plan or region. Break results down with customer segmentation.
- Close the loop. Follow up with detractors and low CSAT respondents quickly, and tell customers what changed because of their feedback.
- Report both in one place. Track CSAT and NPS next to your other customer retention metrics so trends are read in context.
The Gap Both Metrics Leave: Why Customers Actually Cancel
CSAT and NPS describe how customers feel while they are still customers. Neither one tells you why a specific customer decided to leave today. A detractor may stay for years, and a promoter may cancel because their budget was cut or their project ended.
That is why the cancellation moment deserves its own survey. When a customer clicks cancel, a short question about their reason gives you the most direct churn data you will get, and it arrives while you can still respond. It also reaches the customers who ignored every NPS email. For question ideas, see our list of questions to ask churned customers, and for how to turn the answers into patterns, our guide to analyzing customer churn causes.
Churnfree runs the cancellation flow for subscription businesses, so this feedback is collected at the exact moment of churn:
- Ask why customers cancel. Churnfree cancellation flows let you run surveys and gather feedback inside the flow.
- Collect answers in their own words. A customizable feedback form gathers open feedback, which you can search by retention flow and filter by date.
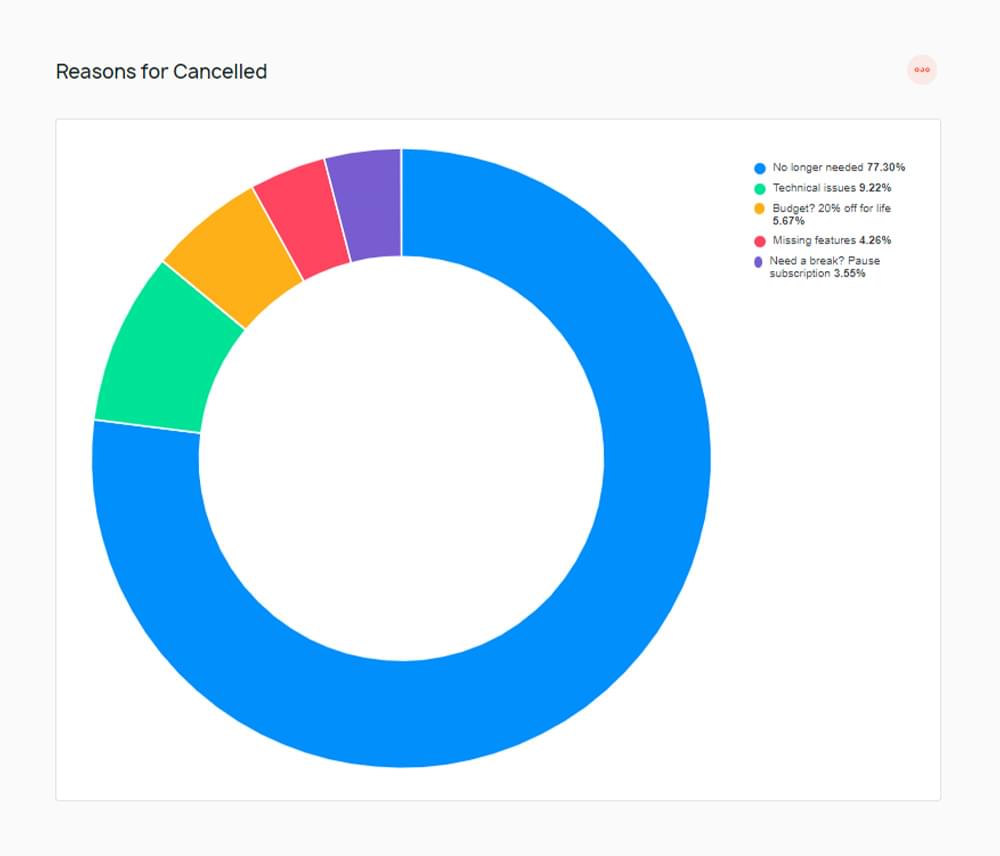
- Compare reasons with results. The analytics dashboard includes reason for cancellation vs retention data charts, so you can see which reasons your offers are able to fix.
- Respond to the answer. Churnfree offers, including discounts, trial extensions, pauses, skips and plan switches, can be presented based on survey answers and personalized by tenure, usage and other targeting parameters.
Read cancellation reasons next to your NPS and CSAT trends. If detractor comments mention a missing integration and the same reason tops your cancellation chart, you have a priority backed by two sources. To see how the cancel step itself should be designed, read our guide to the cancel flow.
Conclusion
Pick the metric that matches the decision you need to make: CSAT for whether a touchpoint works, NPS for whether customers will stay and recommend you, CES for whether something is too hard. Then add a survey at the cancellation step, so you also hear from the customers who are leaving.
Try Churnfree to learn why customers cancel and give them a reason to stay.
Frequently Asked Questions About CSAT vs NPS
What Is the Main Difference Between CSAT and NPS?
CSAT measures how satisfied a customer is with a specific interaction, product or feature, usually on a 1 to 5 scale. NPS measures how likely a customer is to recommend your company, on a 0 to 10 scale, so it reflects loyalty to the whole relationship rather than one moment.
Is NPS Better Than CSAT?
Neither is better overall. NPS is better for tracking loyalty and spotting churn risk over time. CSAT is better for judging whether a specific touchpoint, such as a support ticket or onboarding call, worked. Most SaaS teams use both.
What Is the Difference Between CSAT, NPS and CES?
CSAT asks whether an experience was good, NPS asks whether the customer would recommend you, and CES asks how easy it was to get something done. CSAT and CES measure specific moments. NPS measures the overall relationship.
How Often Should You Send NPS and CSAT Surveys?
Send CSAT right after the interaction you want to measure. Send relationship NPS on a fixed schedule, such as quarterly or twice a year, and at key lifecycle points like a few weeks before renewal. Avoid surveying the same customer so often that they stop responding.
Do CSAT and NPS Predict Churn?
They help, but only partly. Detractors and low scores are useful risk signals, especially when combined with usage data. They do not capture customers who stop responding or cancel for reasons unrelated to satisfaction, so pair them with a cancellation survey.